Sales Analytics in the DIKIDI Business App
Last modified:
The Sales feature is made to account for completed sales of goods and services, as well as to analyze company's results.
Based on this data, you can check the revenue brought by each of employees, view the most profitable services and products, analyze the sales volume of each employee, etc.
To view this information, go to More - Sales. The feature consists of two sections: Analytics and Sales list.
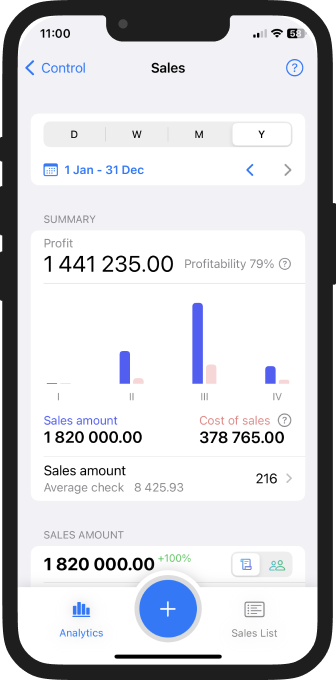
The sales summary allows you to estimate your profit, taking into account sales revenue and cost of sales.
Profit shows the amount of sales minus the cost of services provided or goods sold.
Revenue (sales amount) is the sum of all sales, the total amount of funds received from customers.
Cost of sales includes all costs for the provision of services and the sale of goods (salary, rent, cost of consumables, etc.).
You can also view your percentage of profitability for the selected period, which is calculated as profit divided by revenue (sales amount) in percent.
One of the most important indicators of your business is the Average check (receipt), this is sales amount divided by sales number for a certain period.
In the section, you can view statistics for any period from 1 day to 1 year.
Check below information about detailed reports on sales amount and cost.
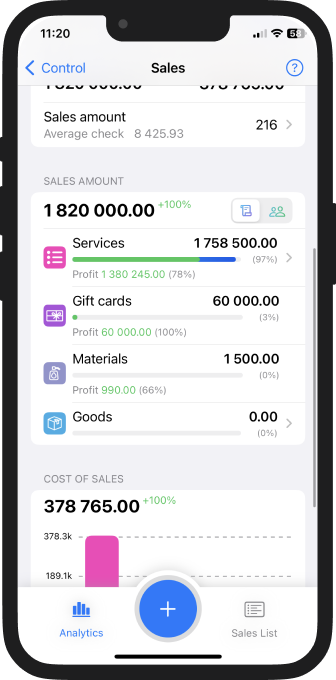
In this subsection, the sales amount index is divided into different types of goods sold (services, materials, gift cards etc.) and employees.
Product type report:
As well as in the overall results, you can view: sales amount (blue bar), profit (green bar) and profitability in percent. Sometimes instead of profit you will see loss (red bar) - it means that in the selected period the costs for this product type exceeded the proceeds from its sales.
In a detailed report check data for each service provided and each product sold. Click on Services or Products to open the report.
Employee report:
To view report on top employees, toggle the sales amount icon on the employee icon in the upper right corner (the Sales amount section).
The report shows sales volume (blue bar), profit (green bar) and profitability by each employee. Tap on employee's line or on Details/More to see detailed information of all staff.
Another part of the Sales section is the Sales list. All sales completed for the selected period are displayed here.
You can find any sale or select the ones with a debt, or view sales of every employee.
For a quick search, use filters in the upper right corner.
This feature is paid, it is included in the Minimum, Standard, Full plans. Also you can enable this module separately.
Based on this data, you can check the revenue brought by each of employees, view the most profitable services and products, analyze the sales volume of each employee, etc.
To view this information, go to More - Sales. The feature consists of two sections: Analytics and Sales list.
Sales analytics
1. Summary
The sales summary allows you to estimate your profit, taking into account sales revenue and cost of sales.
Profit shows the amount of sales minus the cost of services provided or goods sold.
Revenue (sales amount) is the sum of all sales, the total amount of funds received from customers.
Cost of sales includes all costs for the provision of services and the sale of goods (salary, rent, cost of consumables, etc.).
You can also view your percentage of profitability for the selected period, which is calculated as profit divided by revenue (sales amount) in percent.
One of the most important indicators of your business is the Average check (receipt), this is sales amount divided by sales number for a certain period.
In the section, you can view statistics for any period from 1 day to 1 year.
Check below information about detailed reports on sales amount and cost.
2. Sales amount
In this subsection, the sales amount index is divided into different types of goods sold (services, materials, gift cards etc.) and employees.
Product type report:
As well as in the overall results, you can view: sales amount (blue bar), profit (green bar) and profitability in percent. Sometimes instead of profit you will see loss (red bar) - it means that in the selected period the costs for this product type exceeded the proceeds from its sales.
In a detailed report check data for each service provided and each product sold. Click on Services or Products to open the report.
Employee report:
To view report on top employees, toggle the sales amount icon on the employee icon in the upper right corner (the Sales amount section).
The report shows sales volume (blue bar), profit (green bar) and profitability by each employee. Tap on employee's line or on Details/More to see detailed information of all staff.
3. Cost of sales
To evaluate and employee performance and sales in general, it's necessary to take costs into account. Our system calculates costs automatically based on the settings of employee salaries, the cost of purchased materials and products.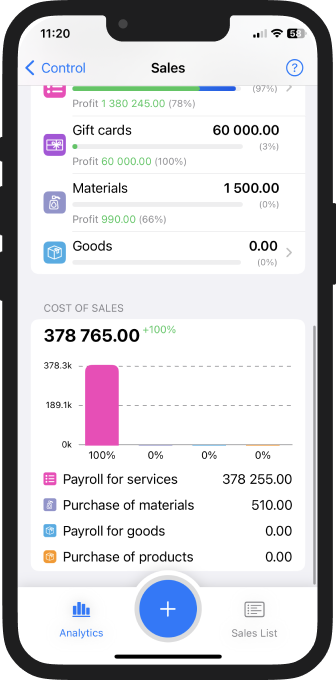
Sales list
Another part of the Sales section is the Sales list. All sales completed for the selected period are displayed here.
You can find any sale or select the ones with a debt, or view sales of every employee.
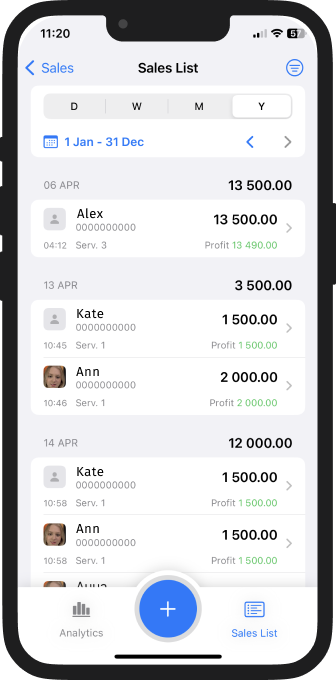
For a quick search, use filters in the upper right corner.
This feature is paid, it is included in the Minimum, Standard, Full plans. Also you can enable this module separately.