How to Analyze Sales on the Website
Last modified:
Analytics is exactly what gives you specifics. The most important information about the activities of any company.
Analytics is the result of the work of employees, sales volume, and revenue. And only by these results, it's possible to reveal the development path. Therefore, we have specifically highlighted this section Analytics in the Sales functionality.
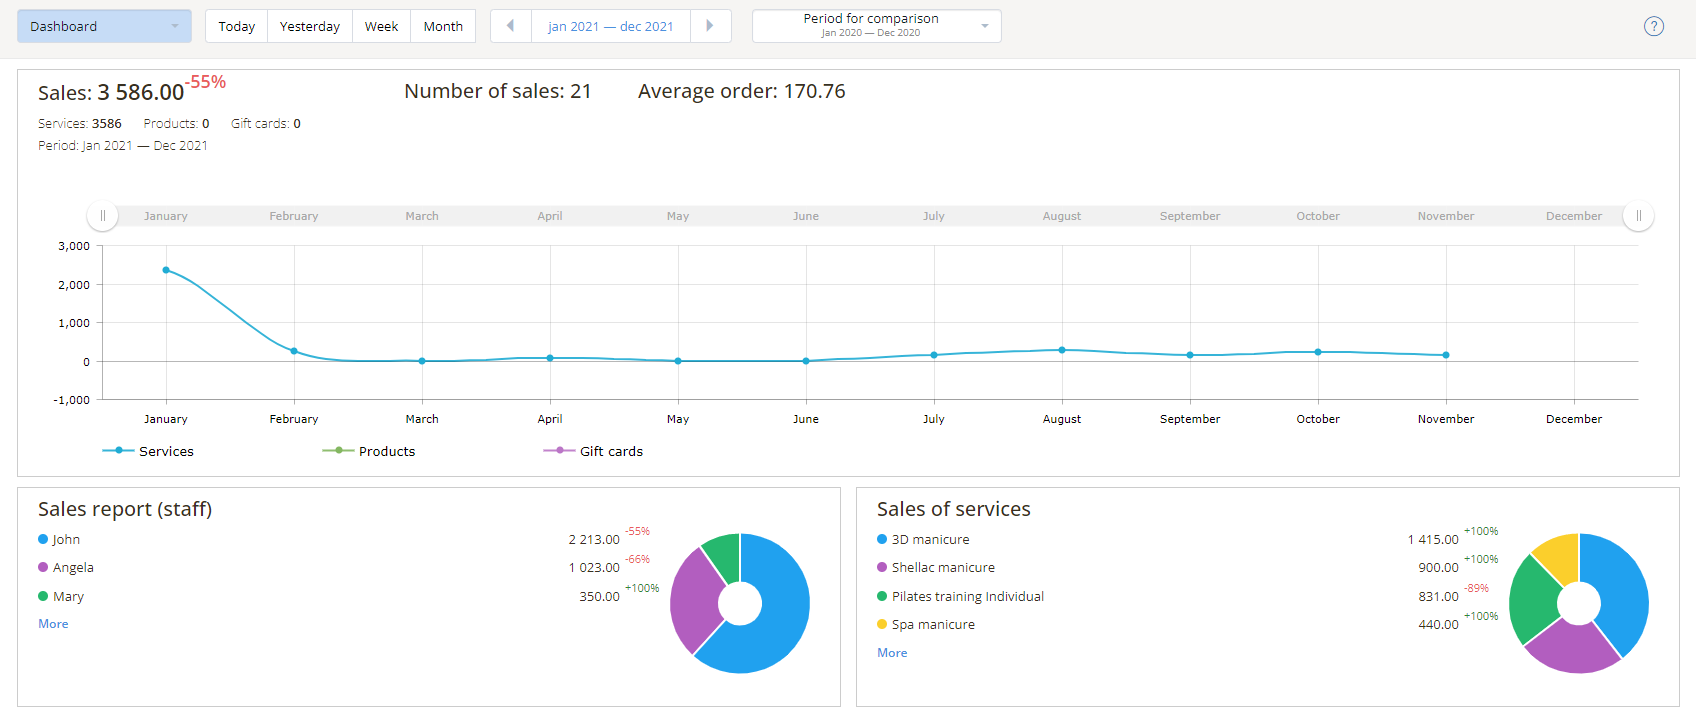
You can view the company's sales analytics. By default, when you go to this section, the Dashboard opens - a generalized report on sales of goods and services in your company.

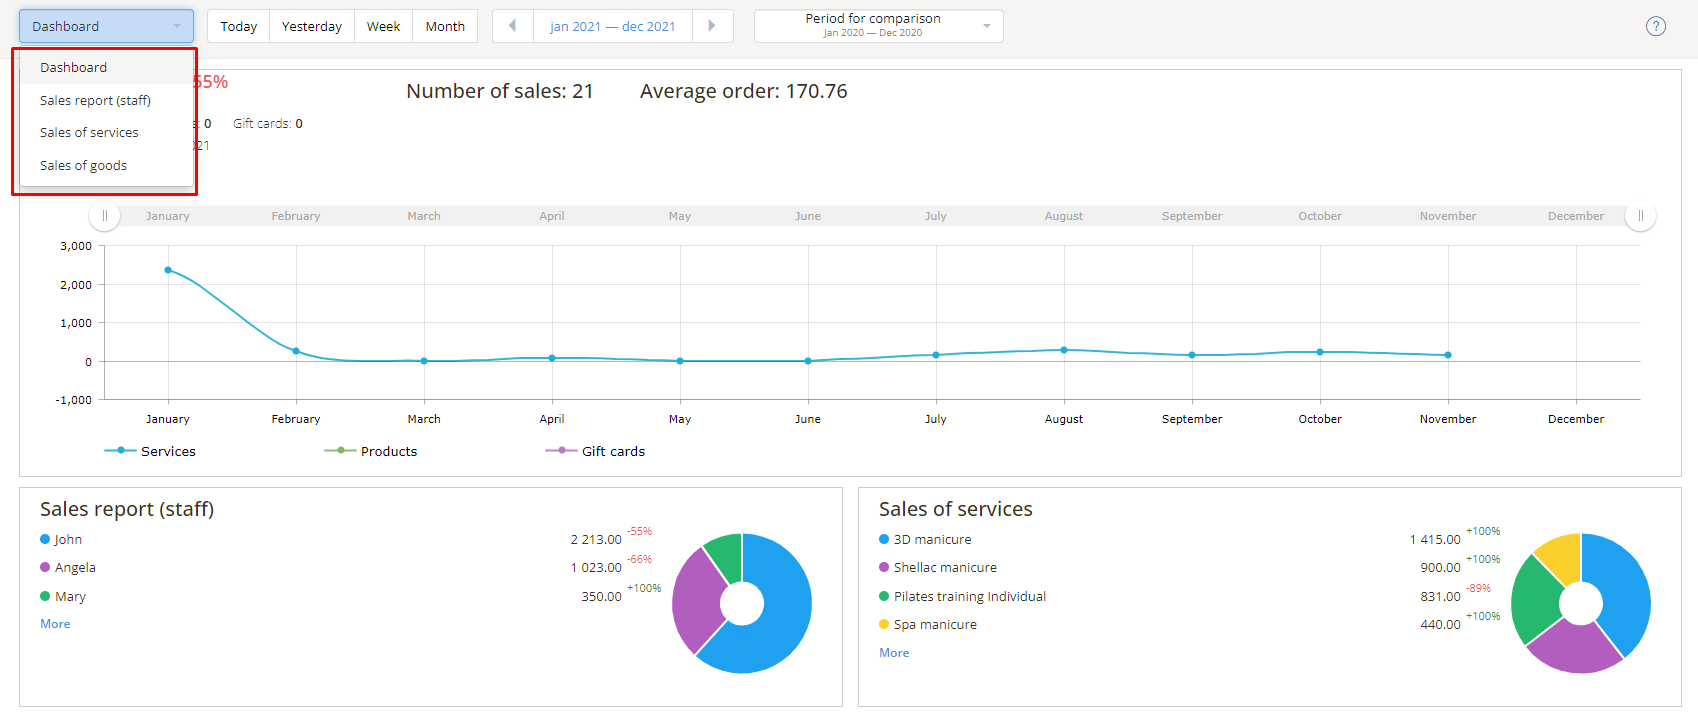
You can also view detailed information. For example, a report on the sale of services, goods, and employees.

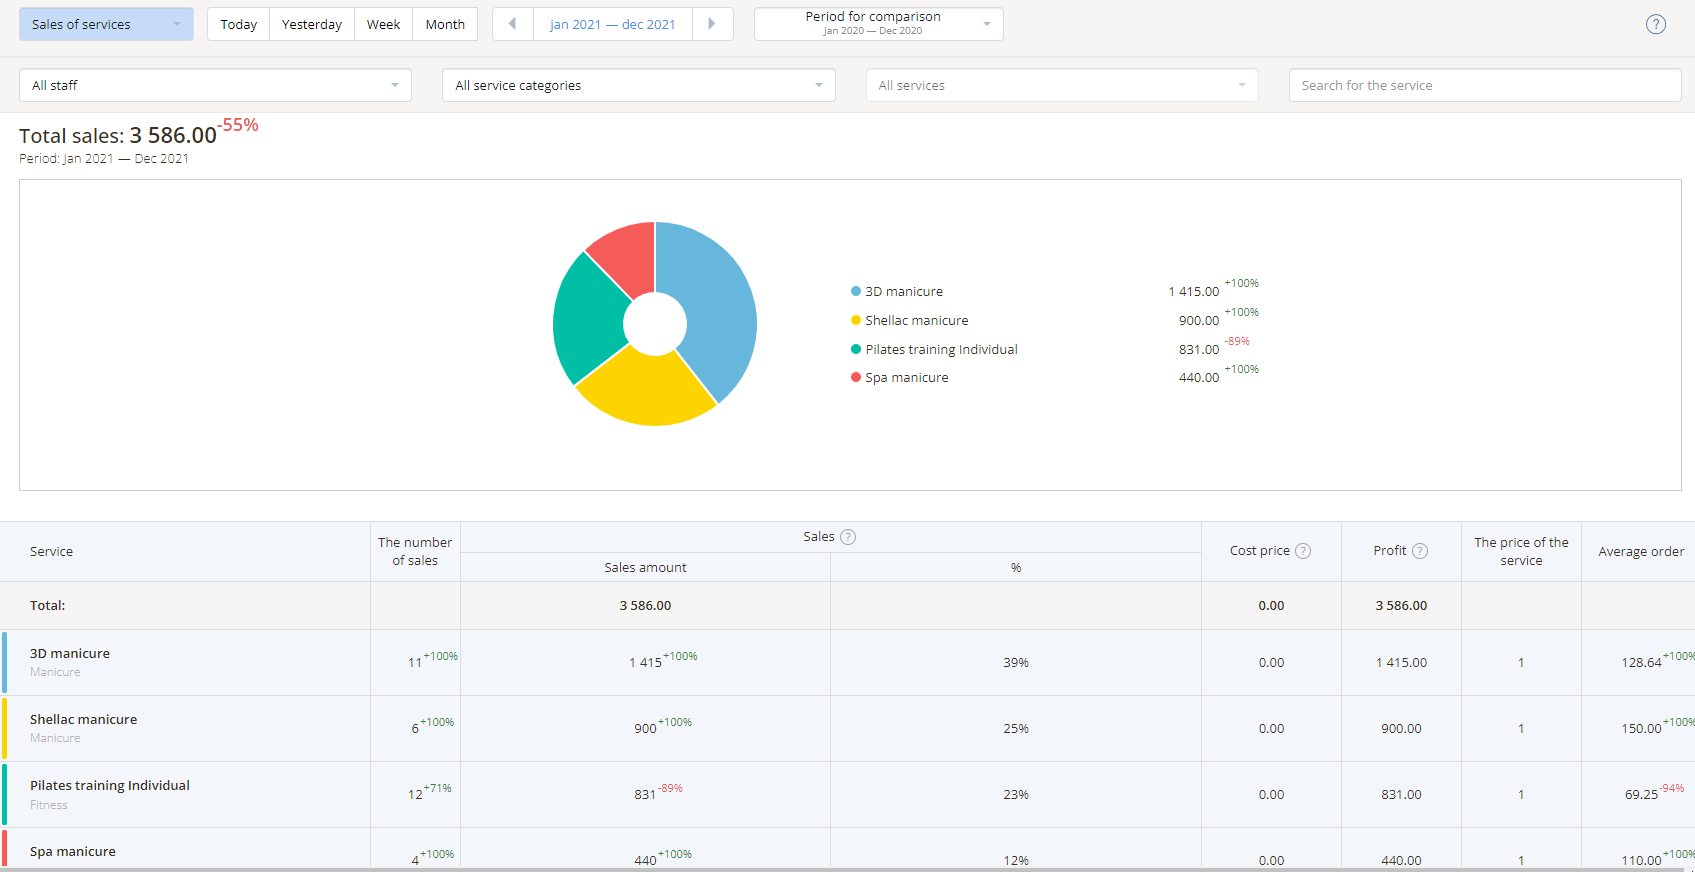
Analysis of how your services are sold is one of the most important aspects for the formation of a high-quality price list in a company. It's these data that will tell you which services bring the maximum profit, and which for some reason are not in particular demand.
Using filters, you can view a detailed report on services by employees or service categories.

The staff report shows detailed information about the sales volume of each employee, as well as sales dynamics. Various filters help to clarify necessary information.
Similar functions are available for products, you can view the best-selling products, compare costs, and estimate your profit from the sale of each specific product.
The Sales functionality is available in the paid plans Minimum, Standard, and Full, you can also connect this module separately.